

Inside Canal Trucking Insurance Rates: What Cogo Found in the Filed Formula
Summary
Most trucking companies know that accidents, violations, operating radius, cargo, and years in business affect insurance premiums. What they rarely see is the actual math behind a trucking insurance company’s rating plan.
Cogo Insurance reviewed a detailed Canal Insurance commercial auto liability filing that exposes many of the factors Canal used to calculate trucking premiums. The disclosed plan separately considered the driver’s MVR, age, CDL experience, tenure with the trucking company, years the motor carrier had been in business, rating class, vehicle type and weight, operating geography, liability limits, fleet size, driver-to-truck ratio, vehicle age, commercial credit, and other variables.
Some findings are striking.
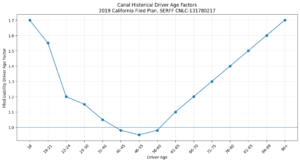
A driver aged 46 to 55 received the lowest disclosed age factor, while both younger and older drivers received progressively higher factors. Ten or more years of CDL experience received a lower factor than zero, one, or two years. Six or more years working for the same motor carrier received a lower factor than being newly hired.
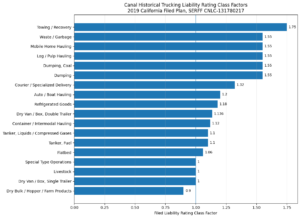
The trucking operation itself could produce an even larger difference. In Canal’s disclosed plan, dry bulk, hopper, or farm-product hauling carried a 0.90 liability rating factor. A single-trailer dry van was 1.00. Refrigerated freight was 1.18. Auto hauling was 1.20. Dumping, logging, mobile-home hauling, and waste hauling were 1.55. Towing and recovery reached 1.75.
The filing reveals another important distinction: Canal’s trucking commodity factor was 1.00 for liability. Much of the difference associated with what a truck hauls appeared through the rating class, not a separate commodity multiplier.
The exact factors discussed in this article come from Canal’s approved 2019 California commercial auto filing, SERFF CNLC-131780217. They should not be represented as Canal’s current 2026 Ohio, Texas, Illinois, or Pennsylvania rates. Current Canal filings show that its commercial auto rates continue to change. The older filing is valuable because it provides an unusually detailed public look at the mechanics behind a sophisticated trucking rating plan.
Cogo Found the Actual Canal Liability Formula
This is where the filing becomes particularly useful.
Canal’s disclosed trucking auto liability calculation incorporated the following variables:
Base Premium × Radius Factor × Vehicle Type Factor × Rating Class Factor × Increased Limit Factor × Time in Business Factor × Territory Factor × Market Tier Factor × Average Driver Factor × Number of Power Units Factor × Commodity Factor × Venue Factor × Risk Tier Factor × Driver-to-Vehicle Ratio × Vehicle Age Factor × Commercial Credit Tier Factor + Liability Expense Constant
The filing even imposed limits on the combined Market Tier and Risk Tier components.
That formula helps explain why two trucking companies that appear similar on the surface can receive very different premiums.
At Cogo Insurance, we often see trucking owners focus almost entirely on one question:
“My driver has a clean record, so why is the insurance expensive?”
Canal’s disclosed formula shows why that question is incomplete.
The insurer can be evaluating the driver, tractor, type of trucking, years in business, routes, liability limit, driver-to-truck ratio, vehicle age, fleet characteristics, geography, prior losses, and other variables simultaneously.
What Cargo Was Cheapest and Most Expensive?
Here is the surprising part.
In this disclosed Canal liability plan, commodity itself did not produce different BI or PD liability factors for trucks, tractors, and trailers.
The liability commodity table states:
| Commodity Category | BI Liability Factor | PD Liability Factor |
|---|---|---|
| All trucking classes | 1.00 | 1.00 |
That does not mean what the truck hauled was irrelevant.
Canal separately classified operations into rating classes. That is where large differences appeared.
So the more accurate way to describe the structure is:
Commodity or operation information -> trucking classification -> Rating Class Factor -> liability premium
rather than:
Commodity -> separate commodity surcharge
Current Canal mileage-based programs still say rate characteristics can include the type of operation, and Canal says estimated mileage can consider the commodity hauled, unit type, and location.
Canal’s Trucking Rating Classes: From Cheapest to Most Expensive
For ordinary trucks, tractors, and trailers, Canal’s historical filed liability factors were:
| Trucking Rating Class | Canal Liability Factor | Difference vs. Single-Trailer Dry Van |
|---|---|---|
| Dry Bulk, Hopper or Farm Products | 0.900 | 10% lower |
| Dry Van or Box, Single Trailer | 1.000 | Baseline |
| Livestock | 1.000 | Baseline |
| Special Type Operations | 1.000 | Baseline |
| Flatbed | 1.060 | 6% higher |
| Tanker, Fuel | 1.100 | 10% higher |
| Tanker, Liquids or Compressed Gases | 1.100 | 10% higher |
| Container / Intermodal Hauling | 1.120 | 12% higher |
| Dry Van or Box, Double Trailer | 1.136 | 13.6% higher |
| Refrigerated Goods | 1.180 | 18% higher |
| Auto or Boat Hauling | 1.200 | 20% higher |
| Courier / Specialized Delivery | 1.320 | 32% higher |
| Dumping | 1.550 | 55% higher |
| Dumping, Coal | 1.550 | 55% higher |
| Log or Pulp Hauling | 1.550 | 55% higher |
| Mobile Home Hauling | 1.550 | 55% higher |
| Waste or Garbage | 1.550 | 55% higher |
| Towing and Recovery | 1.750 | 75% higher |
These are multiplicative liability rating factors. They are not the percentage of the final premium attributable to the operation.
Graphic: Canal’s filed liability rating classes
What was cheapest?
Among the ordinary for-hire trucking classifications in the table, Dry Bulk, Hopper or Farm Products had the lowest factor at 0.90.
Single-trailer dry van, livestock, and certain special operations were neutral at 1.00.
There were lower factors in the complete Canal table, including service-use trucks at 0.35, contractors at 0.60, and non-trucking liability at 0.10. Those are fundamentally different insurance exposures and should not be compared with an interstate for-hire Class 8 truckload operation.
What was most expensive?
Towing and Recovery carried the highest truck rating-class factor in the disclosed table at 1.75.
Among operations more comparable to conventional freight trucking, the highest group was:
Dumping, coal dumping, log or pulp hauling, mobile-home hauling, and waste or garbage hauling: 1.55.
Courier and specialized delivery followed at 1.32.
Auto or boat hauling was 1.20.
Refrigerated freight was 1.18.
The result is somewhat counterintuitive in places. For example, the filed tanker factor was 1.10, below reefer at 1.18 and auto hauling at 1.20.
This is why Cogo Insurance believes actual carrier rating information is more useful than generic assumptions about which trucking operations “sound dangerous.”
Dry Van vs. Reefer vs. Flatbed
These three are particularly relevant because Canal currently describes Dry Van, Reefer, and Flatbed as ideal operation classes for its Miles per Canal program.
In the historical liability filing:
| Operation | Factor |
|---|---|
| Dry Van, Single Trailer | 1.00 |
| Flatbed | 1.06 |
| Refrigerated Goods | 1.18 |
So, all else being equal under that historical rating structure:
Dry van was cheapest.
Flatbed carried a modest debit.
Reefer carried a larger debit.
This does not mean Canal currently quotes every reefer 18 percent above every dry van. The current rating plan, territory, loss history, mileage, driver data, market tier, and other variables can change the result.
It does show that Canal historically recognized these operations as different liability exposures.
Double Trailer vs. Single Trailer
Canal’s disclosed factor was:
| Configuration | Factor |
|---|---|
| Single-trailer dry van or box | 1.000 |
| Double-trailer dry van or box | 1.136 |
The double-trailer operation therefore carried a 13.6 percent higher rating-class relativity in the disclosed plan.
This is much more informative than simply asking whether the driver possesses a T endorsement for doubles and triples.
The insurance effect came from actually operating the configuration, not merely possessing the CDL endorsement.
Vehicle Type and Weight Also Changed Liability Pricing
Canal separately rated vehicle type and gross vehicle weight.
For BI and PD liability, the filed factors for trucks and tractors were:
| Vehicle | GVW | Liability Factor |
|---|---|---|
| Truck | 0 to 10,000 | 0.678 |
| Truck | 10,001 to 20,000 | 0.678 |
| Truck | 20,001 to 45,000 | 0.825 |
| Truck | Over 45,000 | 1.000 |
| Tractor | 20,001 to 45,000 | 0.825 |
| Tractor | Over 45,000 | 1.000 |
| Trailer | Any | 0.030 |
The factors were the same for BI and PD liability in the table.
For the Class 8 trucking accounts Cogo Insurance is examining, the relevant point is that Canal’s plan did not simply classify something as “a tractor.”
Rated weight changed the liability factor.
A tractor in the 20,001 to 45,000 range received 0.825, while an over-45,000 tractor received 1.00.
The filing uses its own GVW bands rather than the federal Class 1 through Class 8 terminology, so the policy’s actual rated weight must be used.
The Individual CDL Driver Could Change the Premium Dramatically
The driver section is probably the most valuable part of Canal’s disclosure.
For risks with 10 or fewer power units, Canal calculated an Average Driver Factor using four separate components:
- MVR violations and accidents
- Driver age
- CDL driving experience
- Driver tenure
Canal multiplied those four factors for each driver, ranked the drivers from highest factor to lowest, removed excess drivers beyond the number of power units, averaged the remaining driver factors, and applied the result to each vehicle’s liability premium.
That tells us something important.
A CDL driver’s experience and his or her tenure with the motor carrier were not the same variable.
Driver Age: Canal’s Filed Curve Was U-Shaped
Here were the disclosed factors:
| Driver Age | Factor |
|---|---|
| 18 | 1.6995 |
| 19 to 21 | 1.55 |
| 22 to 24 | 1.20 |
| 25 to 30 | 1.15 |
| 31 to 40 | 1.05 |
| 41 to 45 | 0.98 |
| 46 to 55 | 0.95 |
| 56 to 60 | 0.98 |
| 61 to 65 | 1.10 |
| 66 to 70 | 1.20 |
| 71 to 75 | 1.30 |
| 76 to 80 | 1.40 |
| 81 to 85 | 1.50 |
| 86 to 89 | 1.60 |
| 90+ | 1.70 |
Graphic: Canal’s historical driver-age curve
The lowest age factor occurred at 46 to 55.
The factor fell as younger drivers aged into the middle-age groups, reached its minimum at 46 to 55, and then increased again.
This is unusually useful public evidence that driver age has at least historically been a genuine trucking liability rating variable at Canal.
CDL Experience Had Its Own Factor
Canal separately measured years of CDL driving experience:
| CDL Driving Experience | Factor |
|---|---|
| 0 years | 1.20 |
| 1 year | 1.14 |
| 2 years | 1.09 |
| 3 to 9 years | 1.00 |
| 10+ years | 0.98 |
The progression is clear.
A driver with no CDL experience received a 20 percent relativity above the 3 to 9 year baseline.
A driver with 10 or more years received a modest credit.
Current Canal programs continue to show that experience matters. Miles per Canal currently requires all drivers to hold a Class A CDL with at least two years of OTR experience.
Driver Tenure Was Separate From CDL Experience
Canal’s historical driver-tenure factors were:
| Years With Motor Carrier | Factor |
|---|---|
| 0 | 1.10 |
| 1 | 1.10 |
| 2 | 1.08 |
| 3 | 1.04 |
| 4 | 1.00 |
| 5 | 0.96 |
| 6+ | 0.92 |
This is a major finding for trucking companies.
A veteran CDL driver who changes companies can still differ from an equally experienced driver who has spent years operating for the same motor carrier.
That distinction makes operational sense. A longer-tenured driver may know:
- the company’s equipment
- dispatch procedures
- freight
- customers
- routes
- maintenance process
- safety rules
- management expectations
Canal’s filed plan gave that stability an explicit mathematical value.
MVR Points Produced a Wide Premium Spread
Canal’s three-year MVR table looked like this:
| MVR Points | Factor |
|---|---|
| 0 | 0.951 |
| 1 | 1.000 |
| 2 | 1.052 |
| 3 | 1.106 |
| 4 | 1.164 |
| 5 | 1.224 |
| 6 | 1.288 |
| 7 | 1.356 |
| 8 | 1.426 |
| 9 | 1.500 |
| 10 | 1.578 |
| 11 | 1.660 |
| 12 | 1.746 |
| 13+ | 1.837 |
A completely clean driver actually received a factor below 1.00.
As MVR points accumulated, the factor rose progressively.
At 9 points it reached 1.50.
At 13 or more it reached 1.837.
And this was only one component of the driver calculation.
Canal then multiplied the MVR factor by the driver’s age factor, CDL experience factor, and tenure factor.
This helps explain why two trucking companies can both describe their drivers as “experienced” while producing very different underwriting results.
The Number of Drivers Per Truck Mattered
Canal separately measured the ratio of drivers to power units for risks with 10 or fewer power units:
| Drivers Per Power Unit | Factor |
|---|---|
| 1.0 or less | 1.00 |
| More than 1.0 through 1.5 | 1.05 |
| More than 1.5 | 1.15 |
A company with substantially more drivers than tractors could therefore receive another debit.
This is particularly interesting when considered alongside driver turnover.
A trucking company with three tractors and a constantly rotating roster of six or seven drivers does not look the same as a three-truck operation with three long-tenured CDL drivers.
Years in Business Had a Clear Effect
Canal’s motor-carrier age factors were:
| Years in Business | Factor |
|---|---|
| 0 | 1.16 |
| 1 | 1.09 |
| 2 | 1.09 |
| 3 | 1.08 |
| 4 | 1.06 |
| 5 | 1.03 |
| 6 | 0.99 |
| 7 | 0.98 |
| 8 | 0.97 |
| 9 | 0.96 |
| 10+ | 0.95 |
This creates three distinct experience questions for Cogo Insurance when reviewing a trucking company:
How long has the company existed?
How long has each driver held and used a CDL?
How long has each driver worked for this particular company?
Canal historically rated all three separately.
The Age of the Tractor Affected Liability Too
Vehicle age was another direct BI and PD liability factor:
| Vehicle Age | Factor |
|---|---|
| New | 0.85 |
| 1 year | 0.87 |
| 2 years | 0.89 |
| 3 years | 0.91 |
| 4 years | 0.93 |
| 5 years | 0.95 |
| 6 years | 0.98 |
| 7 years | 1.00 |
| 8 years | 1.02 |
| 9 years | 1.04 |
| 10+ years | 1.05 |
This is noteworthy because many trucking owners think truck age mainly affects physical damage.
Canal’s disclosed plan applied vehicle age directly to bodily injury and property damage liability.
A new tractor received 0.85.
A tractor ten years or older received 1.05.
Where the Truck Actually Operated Could Matter Enormously
For unlimited-radius trucking, Canal used IFTA mileage to calculate a Venue Factor.
The disclosed regional factors were:
| Operating Region | Venue Factor |
|---|---|
| Western States | 0.777 |
| South-Central States | 0.933 |
| Midwestern States | 1.036 |
| Southern States | 1.192 |
| California | 1.192 |
| Florida | 1.295 |
| Northeastern States | 1.451 |
This is particularly relevant to the four states Cogo has been researching.
In Canal’s disclosed regional definitions:
Ohio and Illinois were Midwestern States.
Texas was South-Central.
Pennsylvania was Northeastern.
The differences are large.
A Northeast factor of 1.451 represents a very different rating environment from a South-Central factor of 0.933.
For an unlimited-radius carrier, Canal did not simply ask where the company was headquartered. It used the miles actually driven by region, based on four quarters of IFTA data.
That makes IFTA reports potentially valuable insurance-rating information.
It also validates a point Cogo Insurance frequently makes to trucking companies:
Garaging ZIP is not the same thing as operating geography.
An Ohio trucking company running heavily into Pennsylvania, New Jersey, New York, Connecticut, and Massachusetts can present a different rating profile from an Ohio company spending most of its mileage in Ohio, Indiana, Kentucky, and surrounding states.
Operating Radius Worked Alongside a Different Long-Haul Base Rate
Canal’s disclosed truck radius factors were:
| Radius | Factor |
|---|---|
| 0 to 75 miles | 0.90 |
| 0 to 150 miles | 1.00 |
| 0 to 300 miles | 1.10 |
| 0 to 500 miles | 1.00 |
| Unlimited | 1.00 |
At first glance, this might make unlimited-radius trucking look no more expensive than 150 miles.
That would be the wrong interpretation.
Canal’s filing states that the 0 to 500 and unlimited factors apply to a different unlimited-radius base rate, while the shorter-radius factors apply to local base rates.
So radius influenced pricing in two stages:
Which base rate applies
and
which radius factor applies to that base
For modern Canal mileage products, actual miles can become even more direct.
Canal Now Has Auto Liability That Can Literally Be Priced by the Mile
Canal’s current Miles per Canal program uses telematics to report mileage.
The auto liability charge is calculated as:
Miles driven × the insured’s rate per mile = monthly auto liability premium
Other coverages such as cargo and physical damage remain fixed rather than mileage-based.
Canal says rate considerations can include:
- driving history
- routes
- operation type
- garage location
Canal also says scheduled estimated miles can consider:
- location
- type of unit
- commodity hauled
This is a major change in how a trucking company can think about insurance exposure.
A truck sitting idle for a large portion of a month does not present the same liability exposure as a truck running 12,000 miles.
In Canal’s mileage programs, that difference can directly affect the bill.
Liability Limits Were Another Major Multiplier
The filing contained detailed increased-limit factors.
For example, the factors increased progressively as liability limits increased. For an over-45,000-pound power unit, the filed factor reached 1.96 at $1 million, compared with 1.00 at the $100,000 reference point in the table.
The practical point for trucking companies is not that a $1 million policy costs exactly 96 percent more than some hypothetical lower-limit policy.
The relevant point is that liability limits sit directly inside the rating algorithm.
For interstate trucking, the policy limit is often controlled by FMCSA requirements, shippers, brokers, contractual requirements, and the nature of the cargo.
Commercial Credit Was in the Formula Too
Canal’s historical plan used a commercial credit score for risks with five or more power units.
The disclosed factors ranged from:
1.15 at Commercial Credit Tier 1
to:
0.85 at Tiers 13 and 14.
That is another reminder that commercial trucking insurance pricing can involve financial variables that have nothing to do with the driver’s MVR or the tractor.
Cogo Insurance would not assume that this exact commercial credit structure is still used in every current Canal state program. The filed evidence shows that commercial credit was one of the mathematical variables in this disclosed version of the plan.
Canal Also Had a Broader Risk Tier
Canal’s Risk Tier Factor applied to power units and trailers and ranged from 0.50 at Risk Tier 0 to 2.00 at the highest disclosed end of the table, with neutral risks receiving 1.00.
That is potentially a very large swing.
The filing limited the combined effect of Market Tier and Risk Tier to a range between 0.58 and 1.80.
This is another reason it is dangerous to look at one individual factor and try to calculate the final premium.
Rating factors interact.
So What Would the Cheapest Canal Trucking Profile Have Looked Like?
Using the historical filed factors purely as a conceptual illustration, the most favorable conventional trucking profile would tend toward characteristics such as:
- clean MVR
- driver in the historically favorable middle-age range
- 10 or more years of CDL experience
- six or more years with the same motor carrier
- established trucking company
- newer tractor
- no excess drivers relative to tractors
- favorable operating geography
- favorable risk and market tiers
- lower-rated trucking operation
Among the ordinary trucking classes, dry bulk, hopper, or farm-product hauling carried the lowest operation factor.
A single-trailer dry van sat at the neutral 1.00 level.
What Produced the Most Expensive Profile?
The opposite characteristics could compound:
- multiple recent MVR points
- very young or older driver under the historical age table
- little CDL experience
- newly hired driver
- new motor carrier
- older tractor
- more than 1.5 drivers per tractor
- unfavorable operating geography
- higher-rated operation
- unfavorable risk tier
- higher liability limits
The operation alone could move from 0.90 for dry bulk to 1.55 for logging, dumping, mobile-home hauling, or waste hauling.
Towing and recovery reached 1.75, though it is not directly comparable with long-haul freight trucking.
This is the core lesson Cogo Insurance takes from the Canal filing:
Premium differences can compound.
A trucking company does not receive one “bad driver surcharge” and stop there.
The insurer may simultaneously be applying multiple favorable or unfavorable variables.
What Has Changed Since This Canal Filing?
The detailed factors in this article come from an approved 2019 California filing. The filing itself showed a 10.3 percent overall rate change at the time.
Canal has continued revising commercial-auto pricing.
A current filing tracker reports these 2026 Canal rate reviews:
| State | 2026 Canal Rate Review | Reported Overall Impact | Reported Maximum Individual Change |
|---|---|---|---|
| Texas | March 23, 2026 | +18.1% | +129.9% |
| Ohio | May 20, 2026 | +11.1% | +39.3% |
| Pennsylvania | July 23, 2026 | +9.0% | +53.6% |
| Illinois | No comparable 2026 rate-impact filing surfaced in the tracker reviewed |
Those numbers should not be interpreted as what every policyholder received at renewal.
An overall filing impact is an aggregate actuarial measure. The maximum individual impact shows that some combinations of classification and rating changes can be far larger than the statewide average.
This is another reason Cogo Insurance would not apply the 2019 California factors directly to a 2026 Ohio, Texas, Illinois, or Pennsylvania quote.
The old filing tells us how Canal has thought about trucking risk mathematically. Current quotes must use current state-specific rates and rules.
What Is Still Relevant in Canal’s Current Products?
Quite a lot.
Canal’s current public material confirms that it remains heavily focused on commercial trucking. Canal Express serves 1 to 10 power-unit accounts, while its broader trucking offerings include larger fleets.
Current Miles per Canal eligibility includes:
- up to 15 units
- Class A CDL drivers
- at least two years of OTR driving experience
- at least three years in business
- company-owned units
- participating telematics
- official DOT number
Its preferred operation classes include dry van, reefer, and flatbed.
Canal’s distribution partner Amwins also identifies driver lists containing date of hire and years of experience among submission information, reinforcing the continuing relevance of driver tenure and experience.
Cogo Insurance’s Main Takeaways From Canal’s Filed Rating Formula
The Canal filing changes how we should think about commercial truck insurance pricing.
1. “Driver experience” is not one variable
Canal separately measured:
- CDL driving experience
- driver age
- MVR
- tenure with the trucking company
A driver with 15 years of CDL experience who started with the insured last month was not identical to a 15-year CDL driver who had worked for the motor carrier for six years.
2. Driver retention has measurable insurance value
The tenure factor dropped from 1.10 for a new driver to 0.92 at six or more years.
That is one of the clearest pieces of public carrier evidence Cogo has found supporting the insurance value of driver retention.
3. Rating class can matter more than commodity
The separate commodity factor was neutral for trucking liability, while the operation class ranged from 0.90 to 1.75 across the trucking categories.
4. Routes can matter more than headquarters
Unlimited-radius risks were rated using IFTA mileage distributed among geographic regions.
A trucking company’s actual lanes therefore mattered.
5. Tractor age can affect liability, not just physical damage
The historical liability factor ranged from 0.85 for a new vehicle to 1.05 for a vehicle ten years or older.
6. Driver count matters
More than 1.5 drivers per power unit produced a 1.15 factor in the disclosed small-fleet plan.
7. Mileage is becoming even more direct
Canal’s current mileage programs can calculate auto liability premium directly from actual miles driven.
Summary
Cogo Insurance’s review of Canal’s public filings provides one of the clearest views available into how a trucking insurer can price commercial auto liability.
The disclosed Canal plan did not rely on a handful of generic factors.
It separately measured:
MVR, driver age, CDL experience, driver tenure, years in business, truck type and weight, vehicle age, rating class, operating radius, territory, IFTA mileage by region, fleet size, driver-to-vehicle ratio, liability limits, commercial credit, market tier, risk tier, and other variables.
For trucking operations, one of the biggest surprises is that the separate commodity factor was neutral in the disclosed liability table. The much larger difference came from rating class.
Dry bulk, hopper, or farm-product hauling was 0.90.
Single-trailer dry van was 1.00.
Flatbed was 1.06.
Tanker was 1.10.
Reefer was 1.18.
Auto hauling was 1.20.
Dumping, logging, mobile-home hauling, and waste hauling were 1.55.
Towing and recovery was 1.75.
Driver characteristics could create another large spread. Canal’s historical filing gave its lowest age factor to drivers aged 46 to 55, rewarded longer CDL experience and longer tenure with the insured motor carrier, and progressively increased the factor as MVR points accumulated.
The exact tables are historical and should not be used to quote a current Canal policy. What they reveal is arguably more valuable: the architecture behind trucking insurance pricing and the relationships among the factors.
For Cogo Insurance clients, that means the best insurance submission is not simply a DOT number, equipment list, and loss runs.
The quality, stability, experience, routes, equipment, operation, and history of the trucking business can all affect the insurance result.
Frequently Asked Questions
Does Canal Insurance use driver age to price trucking insurance?
Canal’s disclosed 2019 California commercial-auto filing explicitly used driver age as part of its Average Driver Factor for risks with 10 or fewer power units. The lowest filed age factor was 0.95 for drivers aged 46 to 55. These historical factors should not be assumed to be Canal’s current factors in other states.
Does CDL experience affect Canal trucking insurance?
Yes, at least in the disclosed Canal plan. Zero years of CDL experience received a 1.20 factor, one year received 1.14, two years received 1.09, three to nine years received 1.00, and ten or more years received 0.98. Canal’s current Miles per Canal program requires participating drivers to have at least two years of OTR driving experience.
Does staying with the same trucking company lower insurance rates?
Canal’s historical plan explicitly rewarded driver tenure. A driver with zero or one year at the company received a 1.10 factor, while six or more years received 0.92. Current rating treatment can differ, but this provides strong evidence that driver stability can matter actuarially.
What trucking operation had the lowest Canal liability factor?
Among comparable trucking operations in the disclosed rating-class table, dry bulk, hopper, or farm products had the lowest factor at 0.90.
Was dry van cheaper than reefer with Canal?
In the historical Canal filing, single-trailer dry van had a 1.00 liability rating-class factor while refrigerated goods had a 1.18 factor. Current quotes may differ.
Was flatbed cheaper than reefer?
Yes, under the disclosed historical rating class. Flatbed was 1.06 while refrigerated goods were 1.18.
How did Canal rate auto haulers?
Auto or boat hauling carried a 1.20 liability rating-class factor in the disclosed filing, 20 percent above the 1.00 single-trailer dry-van rating-class factor.
How did Canal rate tankers?
Fuel tankers and tankers carrying liquids or compressed gases each had a 1.10 liability rating-class factor in the disclosed plan.
What were Canal’s most expensive trucking rating classes?
Towing and recovery was the highest truck rating class in the disclosed table at 1.75. Dumping, coal dumping, log or pulp hauling, mobile-home hauling, and waste or garbage hauling were each 1.55.
Did commodity itself change Canal’s trucking liability premium?
The disclosed trucking liability commodity table assigned a 1.00 factor to all power-unit and trailer classes. Much of the operation-specific difference appeared in Canal’s separate Rating Class Factor.
Does truck weight affect Canal liability pricing?
It did in the disclosed plan. A tractor rated at 20,001 to 45,000 GVW received a 0.825 factor, while an over-45,000 tractor received 1.00.
Does tractor age affect Canal auto liability?
It did in the historical plan. The liability vehicle-age factor ranged from 0.85 for a new vehicle to 1.05 for a vehicle ten years or older.
Does Canal use IFTA reports for insurance pricing?
The disclosed Canal plan used the preceding four quarters of IFTA mileage to determine geographic venue exposure for unlimited-radius risks. If IFTA information was unavailable or incomplete, the filing provided for zone rating instead.
Did Northeast trucking cost more than Midwest trucking under Canal’s filing?
The historical unlimited-radius venue factors were 1.451 for the Northeast and 1.036 for the Midwest. Pennsylvania was assigned to the Northeast, while Ohio and Illinois were assigned to the Midwest. These are historical California-filed factors rather than current state rates.
How was Texas treated geographically?
Texas was part of Canal’s South-Central region in the disclosed plan, with a 0.933 venue factor for unlimited-radius operations.
Does Canal offer pay-per-mile trucking insurance?
Canal currently offers mileage-based products in which auto liability premium can be calculated from actual miles reported through telematics. Canal describes this as miles driven multiplied by the insured’s rate per mile.
What factors determine Canal’s rate per mile?
Canal says potential rate considerations include driving history, routes, operation type, and garage location. Canal also says scheduled estimated mileage can be based on characteristics such as location, unit type, and commodity hauled.
Can Cogo Insurance quote Canal trucking insurance?
Cogo Insurance specializes in trucking insurance and can evaluate the motor carrier’s drivers, equipment, routes, cargo, safety history, loss history, and other information to determine which available trucking insurance markets may fit the account.
Works Cited
Canal Insurance Company, California Commercial Auto Liability and Physical Damage Rates and Rules, SERFF CNLC-131780217. This is the primary source for the historical driver, rating-class, vehicle, venue, liability-limit, credit, and other factor tables discussed in this article.
View the Canal SERFF filing PDF
California Department of Insurance, Public Notice Filing, SERFF CNLC-131780217. Confirms the Canal Trucking filing and its regulatory filing information.
California DOI filing notice
Canal Insurance Company, Miles per Canal. Current information about mileage-based auto liability, eligibility, CDL experience, telematics, preferred operations, and rate considerations.
Miles per Canal
Canal Insurance Company, Canal TestDrive. Current explanation of pay-per-mile auto liability calculations, mileage measurement, and pricing considerations.
Canal TestDrive
Canal Insurance Company, Express. Current information regarding Canal’s small-fleet commercial trucking offering.
Canal Express
Amwins National Transportation Underwriters, Canal Insurance. Current transportation-market information and submission requirements, including driver date-of-hire and experience information.
Amwins Canal market information
FilingFocus, Canal Group Filing Activity. Used for the current 2026 Ohio, Texas, and Pennsylvania commercial-auto rate-review activity discussed above.
Canal filing activity