
Insurance complaints: 2024 statistics from Ohio
Consumers often look for ways to compare insurance companies before choosing a policy. One useful indicator is the insurance complaints ratio published by the Ohio Department of Insurance. It’s the only official source of insurance complaints – more trustworthy than complaints on Google, Yelp, or social media. This ratio shows how many insurance complaints a company receives relative to the statewide average for its insurance line. A ratio of 1 means the company receives an average number of insurance complaints. A ratio above 1 means the company receives more complaints than average. A ratio below 1 means the company receives fewer complaints than expected based on its premium volume.
Complaint ratios can guide decision making, but they should be interpreted carefully. Insurance involves contracts, claims handling, communication, and expectations. Even companies with strong reputations receive complaints. Some complaints reflect legitimate concerns. Others may be based on misunderstandings, coverage limits, or disagreements about the claims process. The complaint ratio is a data point, not a final judgment.
The data below includes homeowners, private auto, and life insurers that write the largest amounts of premium in Ohio. These tables do not reflect every insurer in the state. They show only the top 40-50 premium writers in each category in one state. If there will be interest in this topic we can publish similar statistics from other major states as well.
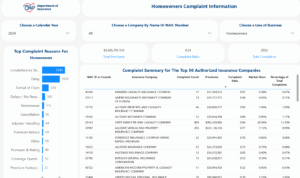
Homeowners Insurance Complaint Ratios in Ohio
Largest Ohio Homeowners Insurers by Complaint Activity
| NAIC ID | Insurance Company | Complaint Count | Premiums | Complaint Ratio | Market Share | % of Total Complaints |
|---|---|---|---|---|---|---|
| 26271 | Erie Insurance Exchange | 12 | $61,795,568 | 0.19 | 1.32% | 0.47% |
| 26263 | Erie Insurance Company | 59 | $306,626,054 | 0.19 | 6.54% | 2.31% |
| 14621 | Motorists Mutual Insurance Company | 6 | $31,182,413 | 0.19 | 0.67% | 0.24% |
| 19992 | American Select Insurance Company | 14 | $79,472,312 | 0.18 | 1.70% | 0.55% |
| 18988 | Auto Owners Insurance Company | 27 | $158,083,112 | 0.17 | 3.37% | 1.06% |
| 26298 | Farmers Property and Casualty Insurance Company | 3 | $17,771,131 | 0.17 | 0.38% | 0.12% |
| 10202 | Ohio Mutual Insurance Company | 8 | $51,581,531 | 0.16 | 1.10% | 0.31% |
| 26131 | Western Reserve Mutual Casualty Company | 7 | $46,360,750 | 0.15 | 0.99% | 0.27% |
| 25968 | USAA Casualty Insurance Company | 7 | $50,582,870 | 0.14 | 1.08% | 0.27% |
| 11982 | Grange Property and Casualty Insurance Company | 6 | $45,773,970 | 0.13 | 0.98% | 0.24% |
| 10677 | The Cincinnati Insurance Company | 10 | $111,510,590 | 0.09 | 2.38% | 0.39% |
| 26123 | Lightning Rod Mutual Insurance Company | 1 | $16,951,897 | 0.06 | 0.36% | 0.04% |
| 20346 | Pacific Indemnity Company | 1 | $18,206,598 | 0.05 | 0.39% | 0.04% |
| 24120 | Westfield National Insurance Company | 2 | $43,343,053 | 0.05 | 0.93% | 0.08% |
| 14044 | Goodville Mutual Casualty Company | 1 | $21,701,789 | 0.05 | 0.46% | 0.04% |
| 28665 | The Cincinnati Casualty Company | 2 | $78,401,690 | 0.03 | 1.67% | 0.08% |
| 14060 | Grange Insurance Company | 8 | — | — | 0.96% | 0.31% |
| 14060 | Grange Mutual Casualty Company | — | $44,864,059 | — | 0.96% | — |
Private Auto Insurance Complaint Ratios in Ohio
Largest Ohio Auto Insurers by Complaint Activity
| NAIC ID | Insurance Company | Complaint Count | Premiums | Complaint Ratio | Market Share | % of Total Complaints |
|---|---|---|---|---|---|---|
| 14249 | Founders Insurance Company | 38 | $40,101,375 | 0.95 | 0.44% | 2.01% |
| 10974 | Root Insurance Company | 33 | $36,756,007 | 0.90 | 0.40% | 1.75% |
| 12188 | Trexis Insurance Corporation | 22 | $37,099,371 | 0.59 | 0.41% | 1.16% |
| 12130 | New South Insurance Company | 48 | $85,127,103 | 0.56 | 0.93% | 2.54% |
| 12484 | Liberty Mutual Personal Insurance Company | 36 | $92,229,835 | 0.39 | 1.01% | 1.90% |
| 37648 | Permanent General Assurance Corporation | 15 | $40,954,697 | 0.37 | 0.45% | 0.79% |
| 39012 | Safeco Insurance Company of Illinois | 48 | $149,230,117 | 0.32 | 1.64% | 2.54% |
| 22906 | Permanent General Assurance Corporation of Ohio | 11 | $34,929,491 | 0.31 | 0.38% | 0.58% |
| 25143 | State Farm Fire and Casualty Company | 43 | $141,155,016 | 0.30 | 1.55% | 2.28% |
| 22780 | Integon General Insurance Corporation | 9 | $29,993,462 | 0.30 | 0.33% | 0.48% |
| 19232 | Allstate Insurance Company | 14 | $48,900,591 | 0.29 | 0.54% | 0.74% |
| 13137 | Viking Insurance Company of Wisconsin | 9 | $33,884,404 | 0.27 | 0.37% | 0.48% |
| 41491 | GEICO Casualty Company | 13 | $53,252,681 | 0.24 | 0.58% | 0.69% |
| 29688 | Allstate Fire and Casualty Insurance Company | 153 | $719,634,271 | 0.21 | 7.90% | 8.10% |
| 16322 | Progressive Direct Insurance Company | 191 | $914,726,459 | 0.21 | 10.04% | 10.11% |
| 36447 | LM General Insurance Company | 8 | $38,787,071 | 0.21 | 0.43% | 0.42% |
| 18600 | USAA General Indemnity Company | 18 | $87,823,228 | 0.20 | 0.96% | 0.95% |
Life Insurance Complaint Ratios in Ohio
Largest Ohio Life Insurers by Complaint Activity
| NAIC ID | Insurance Company | Complaint Count | Premiums | Complaint Ratio | Market Share | % of Total Complaints |
|---|---|---|---|---|---|---|
| 68241 | Prudential Insurance Company of America | 23 | $25,580,544 | 0.90 | 0.58% | 4.80% |
| 65978 | Metropolitan Life Insurance Company | 18 | $34,308,418 | 0.52 | 0.77% | 3.76% |
| 60488 | American General Life Insurance Company | 31 | $76,061,114 | 0.41 | 1.71% | 6.47% |
| 99937 | Columbus Life Insurance Company | 9 | $23,152,719 | 0.39 | 0.52% | 1.88% |
| 86231 | Transamerica Life Insurance Company | 38 | $98,586,923 | 0.39 | 2.22% | 7.93% |
| 91472 | Globe Life and Accident Insurance Company | 9 | $24,115,576 | 0.37 | 0.54% | 1.88% |
| 70483 | Western and Southern Life Insurance Company | 14 | $38,700,041 | 0.36 | 0.87% | 2.92% |
| 58068 | Independent Order of Foresters US Branch | 6 | $28,287,834 | 0.21 | 0.64% | 1.25% |
| 60577 | American Income Life Insurance Company | 16 | $103,619,870 | 0.15 | 2.33% | 3.34% |
| 62944 | Equitable Financial Life Insurance Company | 5 | $33,201,522 | 0.15 | 0.75% | 1.04% |
| 65536 | Genworth Life and Annuity Insurance Company | 5 | $33,961,450 | 0.15 | 0.76% | 1.04% |
| 92622 | Western Southern Life Assurance Company | 7 | $53,682,608 | 0.13 | 1.21% | 1.46% |
| 87726 | Brighthouse Life Insurance Company | 5 | $43,907,491 | 0.11 | 0.99% | 1.04% |
| 66044 | Midland National Life Insurance Company | 4 | $43,848,006 | 0.09 | 0.99% | 0.84% |
How Consumers and Agents Can Use Insurance Complaints Ratios
Complaint ratios are a helpful comparison tool, but they should be viewed alongside other indicators. Financial strength ratings, claims handling reputation, customer service performance, and policy features all matter. Some companies insure more complex risks. Others work with large customer bases that naturally produce more complaints. A higher ratio does not automatically indicate poor performance. A lower ratio does not guarantee perfect service. The goal is to use complaint ratios as part of a broader evaluation process.
FAQ: Ohio Insurance Complaints Ratios
What is a complaint ratio?
It compares the number of complaints a carrier receives to what is expected for a company of its size within the same insurance line.
Is a high complaint ratio always negative?
Not always. Some complaints come from misunderstandings about coverage or disagreements over claims decisions.
Why do large companies sometimes show higher complaint totals?
They handle many more policies, so even a small percentage of disputes can create a noticeable complaint count.
Does a low complaint ratio guarantee good service?
It suggests fewer complaints than average, but service quality should be assessed using multiple factors.
Why are smaller insurers missing from the tables?
The state lists only the companies that write the highest levels of premium. Smaller carriers may not appear even if they have complaints.
Can complaint ratios change year to year?
Yes. They can shift with operational changes, claim volume, staffing, or market conditions.